Items & Rarity
Equipment slots, rarity tiers, attributes, quality scaling, and the tier system
Contents
1. Equipment Slots
Each character has 6 equipment slots:
| Slot | Type | Provides |
|---|---|---|
| Helmet | Armor | base_armor |
| Chest | Armor | base_armor |
| Gloves | Armor | base_armor |
| Boots | Armor | base_armor |
| Shield | Armor | base_armor + inherent block_chance (5–30%) |
| Weapon | Weapon | min_damage, max_damage |
2. Rarity System
Every item has a rarity tier that determines how many bonus attributes it gets and a multiplier on its base stats.
| Rarity | Attributes | Base Stat × | Roll ≤ |
|---|---|---|---|
| Normal | 0 | 0.4× | 100 (36–100) |
| Common | 1 | 0.6× | ≤ 35 |
| Rare | 2 | 0.7× | ≤ 15 |
| Exquisite | 3 | 0.8× | ≤ 5 |
| Epic | 4 | 0.9× | ≤ 1 |
| Ancient | 5 | 1.0× | Epic upgrade only |
The rarity roll is a random integer in [1, roll_max]. Lower results yield rarer items. The default roll_max is 100 (with no magic find).
3. Magic Find
Magic Find (MF) reduces the rarity roll range via a hyperbolic formula with diminishing returns. Every point of MF helps, but each additional point contributes less than the last.
| Magic Find | roll_max | Epic chance | Exquisite+ chance |
|---|---|---|---|
| 0 | 100 | 1.0% | 5.0% |
| 10 | 68 | 1.5% | 7.4% |
| 20 | 52 | 1.9% | 9.6% |
| 40 | 37 | 2.7% | 13.5% |
| 80 | 24 | 4.2% | 20.8% |
| 150 | 16 | 6.3% | 31.3% |
| 500 | 9 | 11.1% | 55.6% |
Magic Find Curve
4. Item Stats
An item's effective combat value scales with its item_level:
Base stats (base_armor, max_damage) are determined by a gaussian roll around the base item's peak value (sigma = 1.5), then multiplied by the rarity's Base Stat × multiplier.
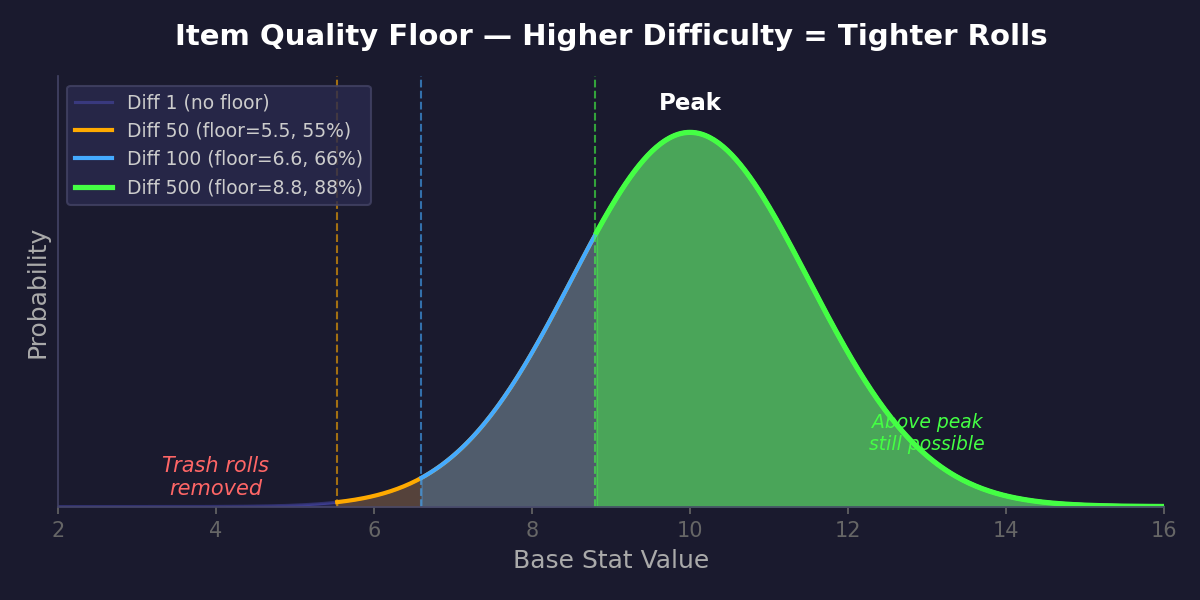
5. Quality Floor
At higher difficulties, a quality floor prevents trash rolls on base stats. The floor is a percentage of the item's peak value that increases with difficulty but never fully reaches 100%.
| Difficulty | Floor % of Peak |
|---|---|
| 10 | 32% |
| 35 | 50% |
| 50 | 56% |
| 100 | 66% |
| 200 | 77% |
| 500 | 88% |
| 1000 | 94% |
Quality Floor Curve
The image below shows how the quality floor (red shaded area) cuts off the bottom of the bell curve at higher difficulties, while the top remains unchanged:
How base stats work (worked examples)
Every item has a tier (1–10) that determines its base stat potential. Higher difficulty drops higher tiers. The base stat is rolled from a bell curve centered on the tier value, then multiplied by a rarity factor (Normal 0.4x, Common 0.6x, Rare 0.7x, Exquisite 0.8x, Epic 0.9x, Ancient 1.0x).
The quality floor clamps the bell curve roll so it can't go below a % of the tier peak. This happens before the rarity multiplier.
Example — Broken Dagger (Tier 1), Epic, at Difficulty 100:
- Bell curve centered on 1, so raw rolls range roughly 0.5–4
- Quality floor at diff 100: 1 × 66% = 0.66 → cuts the very worst rolls
- Epic rarity multiplier: raw roll × 0.9 → final base damage around 0.6–3.6
- Tooltip shows: Damage × (10 + item_level) = base × 110 → 66–396
Example — Dark Lord's Blade (Tier 10), Epic, at Difficulty 100:
- Bell curve centered on 10, so raw rolls range roughly 5–16
- Quality floor at diff 100: 10 × 66% = 6.6 → eliminates sub-7 rolls
- Epic rarity multiplier: raw roll × 0.9 → final base damage around 5.9–14.2
- Tooltip shows: Damage × (10 + item_level) = base × 110 → 649–1,562
tl;dr — higher difficulty = same ceiling, higher floor. You won't get stronger items, but you'll stop getting weak ones.
6. Armor Attributes
Armor items (helmet, chest, gloves, boots, shield) can roll the following attribute types. Each attribute slot is filled once per rarity level above Normal.
| Type | Available Slots | Value Range | Notes |
|---|---|---|---|
| Reduction | All armor | 2–10% | Per-element. Creates weakness to paired element (×0.6–1.2) |
| Reflect | All armor | 2–6% | Per-element. Bounces damage back to attacker |
| Dodge | Helmet, Chest, Gloves, Boots | 2–6% | Avoids entire attack. Can trigger counterattack |
| Heal over Time | Helmet, Chest | item_level × 0.2–0.6 | Min 1 HP/round, heals at start of each round |
| Crit Chance | All armor | 2–6% | Additive |
| Crit Multiplier | All armor | 10–50 | Divided by 100, added to base 2.0× |
| Magic Find | All armor | 2–10 | Reduces rarity roll range (see Magic Find) |
| Flat Reduction | All armor | item_level × 0.3–0.7 | Fixed damage absorbed per-element. No weakness penalty |
| Stun Chance | All armor | 2–10% | On block: chance to stun attacker + deal shield bash damage |
| Counterattack Chance | Helmet, Chest, Gloves, Boots | 2–10% | On dodge: chance to counterattack with full weapon strike |
| Elemental Dmg Boost | All armor | 5–20% | Boosts outgoing damage of a specific non-physical element. Also amplifies reflect. Softcapped at 150% |
7. Weapon Attributes
| Type | Value Range | Notes |
|---|---|---|
| Elemental Damage | 2–15% | Channels a portion of damage through a specific element |
| Life Leech | 2–10% | Heals % of damage dealt per hit |
| Crit Chance | 2–6% | Additive |
| Crit Multiplier | 10–50 | Divided by 100, added to base 2.0× |
| Magic Find | 2–10 | Reduces rarity roll range |
| Summon | 20–50% proc | Boss weapons only. Deals item_level × 2 as single-element damage. Amplified by Elemental Damage Boost |
| Flat Elemental Damage | item_level × 1.0–2.0 | Daggers only. Fixed damage added per-element per hit. Floor at item_level guarantees solid value, ceiling doubles it |
| Flat Life on Hit | item_level × 0.2–0.7 | Fixed heal per hit, independent of damage dealt |
8. Weapon Attribute Drop Rates
Each weapon attribute slot is filled by rolling a weighted category. Daggers have access to Flat Elemental Damage; other weapons do not.
Dominant = element biased toward the area's element (70% single-element areas, 35%+35% dual-element). Random = uniform across all 6 elements. In areas with no element (Verdant Woods) and during smithing reforge, dominant slots use random element instead.
All areas / Smithing reforge
| Attribute | Bias | Non-dagger | Dagger |
|---|---|---|---|
| Elemental Damage (%) | dominant | 30.0% | 10.0% |
| Elemental Damage (%) | random | 20.0% | 5.0% |
| Flat Elemental Damage | dominant | — | 20.0% |
| Flat Elemental Damage | random | — | 15.0% |
| Magic Find | random | 10.0% | 10.0% |
| Life Leech | random | 10.0% | 10.0% |
| Crit Chance | random | 10.0% | 10.0% |
| Crit Multiplier | random | 10.0% | 10.0% |
| Flat Life on Hit | random | 10.0% | 10.0% |
9. Armor Attribute Drop Rates
Armor attributes use a 33% dominant / 67% pool system. The dominant branch is 50/50 between Reduction (area-biased) and Elemental Damage Boost (area-biased). The pool branch picks uniformly from the slot's eligible entries.
Element bias
- Single-element areas: 70% area element, 30% random fallback
- Dual-element areas (Shadow Realm, Dragon's Lair): 35% + 35% area elements, 30% random
- Verdant Woods / Reforge: no dominant — 100% pool, all elements equally likely
In areas with elements, the pool's Reduction entries are filtered to only the area's defensive element(s). This shrinks the pool and increases the chance of each remaining entry.
Helmet / Chest — single-element area
Example: Murky Swamp (defensive = Energy, offensive = Earth). Pool: 11 entries, each 6.09%.
| Attribute | Element | Prob | Source |
|---|---|---|---|
| Reduction | energy | 22.59% | 16.50% dom + 6.09% pool |
| Elemental Dmg Boost | earth | 18.47% | 12.38% dom + 6.09% pool |
| Reflect | earth | 6.09% | pool |
| Dodge | — | 6.09% | pool |
| Heal over Time | — | 6.09% | pool |
| Crit Chance | — | 6.09% | pool |
| Crit Multiplier | — | 6.09% | pool |
| Magic Find | — | 6.09% | pool |
| Flat Reduction | energy | 6.09% | pool |
| Stun Chance | — | 6.09% | pool |
| Counter Chance | — | 6.09% | pool |
| Elemental Dmg Boost | physical | 0.83% | dom leak |
| Elemental Dmg Boost | fire | 0.83% | dom leak |
| Elemental Dmg Boost | ice | 0.83% | dom leak |
| Elemental Dmg Boost | magic | 0.83% | dom leak |
| Elemental Dmg Boost | energy | 0.83% | dom leak |
Gloves / Boots — single-element area
Same as Helmet/Chest but without Heal over Time. Pool: 10 entries, each 6.70%.
| Attribute | Element | Prob | Source |
|---|---|---|---|
| Reduction | energy | 23.20% | 16.50% dom + 6.70% pool |
| Elemental Dmg Boost | earth | 19.08% | 12.38% dom + 6.70% pool |
| Reflect | earth | 6.70% | pool |
| Dodge | — | 6.70% | pool |
| Crit Chance | — | 6.70% | pool |
| Crit Multiplier | — | 6.70% | pool |
| Magic Find | — | 6.70% | pool |
| Flat Reduction | energy | 6.70% | pool |
| Stun Chance | — | 6.70% | pool |
| Counter Chance | — | 6.70% | pool |
| Elemental Dmg Boost | physical | 0.83% | dom leak |
| Elemental Dmg Boost | fire | 0.83% | dom leak |
| Elemental Dmg Boost | ice | 0.83% | dom leak |
| Elemental Dmg Boost | magic | 0.83% | dom leak |
| Elemental Dmg Boost | energy | 0.83% | dom leak |
Shield — single-element area
No Dodge, Heal over Time, or Counter Chance. Pool: 8 entries, each 8.38%.
| Attribute | Element | Prob | Source |
|---|---|---|---|
| Reduction | energy | 24.88% | 16.50% dom + 8.38% pool |
| Elemental Dmg Boost | earth | 20.75% | 12.38% dom + 8.38% pool |
| Reflect | earth | 8.38% | pool |
| Crit Chance | — | 8.38% | pool |
| Crit Multiplier | — | 8.38% | pool |
| Magic Find | — | 8.38% | pool |
| Flat Reduction | energy | 8.38% | pool |
| Stun Chance | — | 8.38% | pool |
| Elemental Dmg Boost | physical | 0.83% | dom leak |
| Elemental Dmg Boost | fire | 0.83% | dom leak |
| Elemental Dmg Boost | ice | 0.83% | dom leak |
| Elemental Dmg Boost | magic | 0.83% | dom leak |
| Elemental Dmg Boost | energy | 0.83% | dom leak |
Verdant Woods / Smithing Reforge
No area element — dominant never fires, 100% pool, full unfiltered pool. All elements equally likely.
| Attribute | Helmet/Chest | Gloves/Boots | Shield |
|---|---|---|---|
| Reduction (per element, ×6) | 6.25% | 6.67% | 7.69% |
| Reflect (random element) | 6.25% | 6.67% | 7.69% |
| Dodge | 6.25% | 6.67% | — |
| Heal over Time | 6.25% | — | — |
| Crit Chance | 6.25% | 6.67% | 7.69% |
| Crit Multiplier | 6.25% | 6.67% | 7.69% |
| Magic Find | 6.25% | 6.67% | 7.69% |
| Flat Reduction (random element) | 6.25% | 6.67% | 7.69% |
| Stun Chance | 6.25% | 6.67% | 7.69% |
| Counter Chance | 6.25% | 6.67% | — |
| Elemental Dmg Boost (random non-phys) | 6.25% | 6.67% | 7.69% |
10. Tier System
Every base item belongs to a tier (1–10). Higher tiers have higher peak stats. When an item drops, the tier is selected using a bell curve that shifts with difficulty.
The bell curve uses breakpoints [50, 100, 250, 999, 3000, 9999]. At each breakpoint, the peak tier advances by 1. Weights decay by 0.66× per tier distance from the peak.
Tier Weight Distribution
Quick Reference
| Difficulty | Most Common Tier | Avg Tier | Chance of T8+ |
|---|---|---|---|
| 1–25 | T1 | 2.8 | 3.8% |
| 50 | T2 | 3.2 | 4.8% |
| 100 | T3 | 3.8 | 6.6% |
| 500 | T4 | 4.5 | 9.6% |
| 1,000 | T5 | 5.2 | 14.2% |
| 5,000 | T6 | 5.8 | 21.4% |